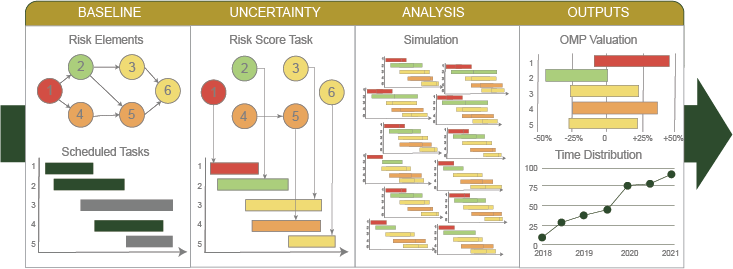
In project management it’s difficult to predict the future, but you can certainly prepare for it. Every project, regardless of the size or scale, should perform a schedule risk analysis in order to improve its predictability, performance and prepare for unforeseen risks. Within ARETE’s Risk Assessment Profiler (RAP), a Schedule Risk Analysis functionality connects the risk assessment information of a project to the baseline schedule to provide sensitivity information of individual tasks to assess the potential impact of uncertainty on the final project duration and cost.
For Example: An Electric Substation Construction Project may have a baseline schedule that determines the project will be completed in 18-months. The project has been broken down into 8 individual tasks, and each of those tasks has a predicted duration that sums up to 18 months.
Substation Site Preparation: is predicted to be completed in 2 months
Foundation Installation: is predicted to be completed in 2 months
Grounding Grid Installation: is predicted to be completed in 1 month, and so on…
Every task has associated risks predefined by the initial risk assessment. These tasks can negatively impact the duration and cost of the individual tasks, ultimately affecting the duration and cost of the overall project. In this example, project managers would perform a Schedule Risk Analysis to assess how the risks associated with Task 1-3 will impact the baseline schedule of the Electric Substation Construction Project.
Schedule Risk Analysis is a process composed of 4 steps:
Define RiskS and baseline schedule
Associate uncertainty to Schedule
Run Monte Carlo Simulations
Interpret the Simulation Results
Below we break down each of those steps and compare it to our example from above:
1. Define Risk and Baseline Schedule: Initially the project manager should perform a risk assessment on the project in order to identify individual risk elements that may have an impact on the project duration and cost. Defining risks can provide the project manager with confidence in the project plan and the dates for important project milestones. Additionally, it will help the project manager forecast completion dates and budget.
In our example: After performing a project risk assessment on The Electric Substation Construction Project, the assessment identified that there is high environmental risk due to the presence of endangered species which is associated with the Task 1 Substation Site Preparation.
2. Associate Uncertainty to Schedule: The baseline schedule is also known as the approved project schedule which may be updated throughout the project’s life cycle. Project managers try to be as accurate as possible when developing the duration of their projects. The other baseline considered is the project budget. All two are important when determining the final outcome of a project.
In our example: The Electric Substation Construction Project has a baseline schedule of 18 months. Task durations were determined as you can see above, Task 1 has a duration of 2 months, etc. Assuming there are 8 tasks total, the length of each task would sum up to the 18 months of the overall project. However, since the site may have environmental risks previously identified Task 1: Substation Site Preparation could delay the project by one or two months, therefore impacting the baseline schedule of 18 months.
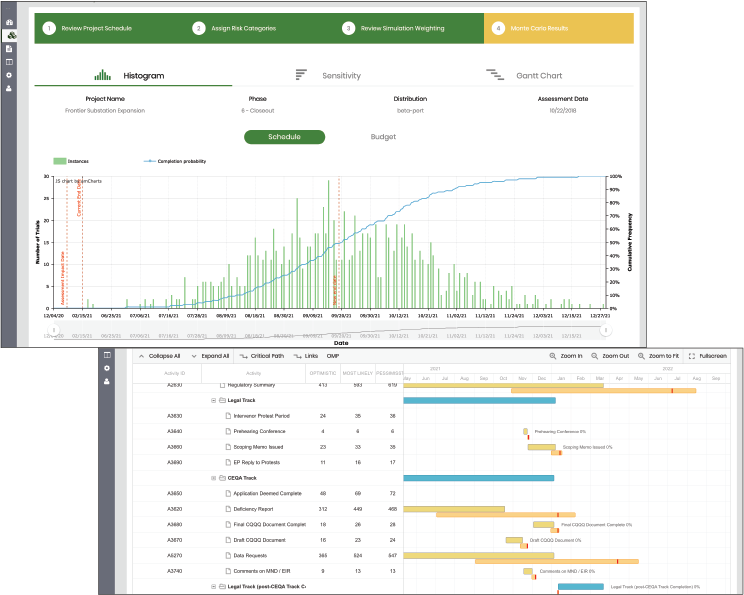
3. Run Monte Carlo Simulations: Three critical aspects of running a successful project are determining the project risks, analyze the schedule, and budget. Since projects contain many sources of variation, all three aspects are intertwined. Therefore, project managers rely on Monte Carlo simulations to quickly generate probabilistic outcomes from simulating real project progress. During each simulation consisting of thousands of iterations, the project schedule and critical paths are recorded in order to measure each task’s criticality, sensitivity and the expected impact of activity variation on the project.
4. Interpret the Simulation Results: The output of a schedule risk analysis is a set of measures that define the degree of criticality, sensitivity, and probabilistic outcomes. These measures refine the black-and-white view of the critical path (which defines that an activity is either critical or not) to a degree of sensitivity, as follows:
Criticality Index (CI): Measures the probability that an activity is on the critical path.
Schedule Sensitivity Index (SSI): Measures the relative importance of an activity taking the criticality index into account.
Cruciality Index (CRI): Measures the correlation between the activity duration/cost and the total project duration/cost.
In summary, Schedule Risk Analysis is one of three key risk analytics. The other two are Qualitative and Quantitative. Go to www.RAPyourRISK.com for more information on Risk-based Portfolio and Project Management tools with RAP.